Statistical Significance: P-values, Errors & Effect Sizes Guide
Statistical significance testing forms the backbone of research evidence across education, psychology, medicine, and countless other fields. Whether you’re evaluating the effectiveness of a new teaching method, assessing child development interventions, or interpreting published research, understanding the trio of p-values, error types, and effect sizes is essential for making informed decisions.
Key Takeaways:
- What does statistical significance actually mean? Statistical significance indicates that your research results are unlikely to have occurred by random chance alone (typically p < 0.05), but it doesn't tell you if the effect is large enough to matter practically – you need effect sizes for that crucial information.
- How do p-values, errors, and effect sizes work together? P-values tell you if an effect is likely genuine, Type I/II errors help you understand reliability limitations, and effect sizes reveal whether statistically significant results are actually important enough to change practice or policy.
- What’s the difference between statistical and practical significance? A study can be statistically significant but practically meaningless (like a 0.1-point improvement on a 100-point test with thousands of participants) or practically important but not statistically significant due to small sample sizes – both pieces are essential for evidence-based decisions.
Introduction
Despite its widespread use, statistical significance remains one of the most misunderstood concepts in research. Many professionals struggle to interpret p-values correctly, confuse statistical significance with practical importance, or overlook crucial error considerations that affect research reliability. This comprehensive guide demystifies these interconnected concepts, providing you with the knowledge to critically evaluate research findings and make evidence-based decisions with confidence.
The journey through statistical significance involves three fundamental components: p-values (which measure the probability of your data under specific assumptions), error types (which help you understand the reliability and limitations of your findings), and effect sizes (which tell you whether statistically significant results actually matter in practice). Together, these elements provide a complete picture of research evidence, moving beyond simple “significant” or “not significant” labels to nuanced understanding of what research findings really mean.
Modern research increasingly emphasises the importance of considering all three components together. The American Statistical Association’s landmark 2016 statement highlighted common misinterpretations of p-values, while educational researchers have long advocated for systematic observation and assessment approaches that consider both statistical and practical significance in evaluating child development and learning outcomes.
Understanding Statistical Significance
What Statistical Significance Really Means
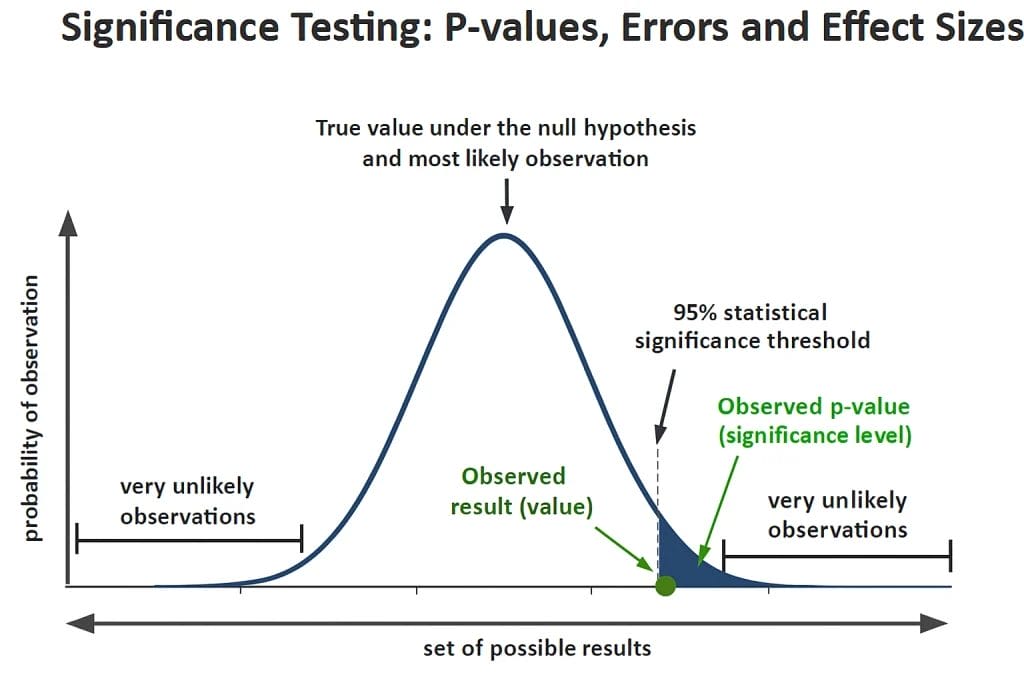
Statistical significance serves as a decision-making tool that helps researchers determine whether observed differences or relationships in their data are likely to reflect genuine effects rather than random chance. At its core, statistical significance testing addresses a fundamental question: “Could these results have occurred by random variation alone, or do they suggest something more meaningful is happening?”
The concept emerged from the need to distinguish between genuine research findings and the natural variability that occurs in any data collection process. When we study groups of children, measure learning outcomes, or compare different educational interventions, we inevitably encounter variation. Some of this variation reflects real differences we want to understand, while some simply represents the natural fluctuations that occur in any measurement process.
Statistical significance testing provides a framework for making this distinction systematically and objectively. Rather than relying on subjective judgments about whether observed differences “look important,” researchers use mathematical tools to quantify the likelihood that their results could have emerged from random chance alone.
However, statistical significance has limitations that are crucial to understand. A statistically significant result doesn’t prove that a hypothesis is correct, nor does it indicate the size or practical importance of an effect. Similarly, results that don’t reach statistical significance don’t prove that no effect exists – they simply indicate that the evidence isn’t strong enough to rule out random chance as an explanation.
Understanding these nuances is particularly important in educational and developmental research, where the stakes of misinterpretation can be high. When evaluating child development theories or research findings, professionals need to move beyond simple significance labels to consider the full context of research evidence.
The Role of Hypothesis Testing
Hypothesis testing provides the logical framework that underlies statistical significance decisions. This process begins with formulating two competing explanations for research findings: the null hypothesis and the alternative hypothesis.
The null hypothesis typically represents the “status quo” or “no effect” position. For example, if you’re evaluating whether a new reading intervention improves children’s literacy skills, the null hypothesis would state that the intervention has no effect – any observed differences between intervention and control groups resulted from random variation rather than the intervention itself.
The alternative hypothesis represents the research prediction you’re trying to support. In the reading intervention example, this would state that the intervention does improve literacy skills, meaning observed differences reflect genuine intervention effects rather than chance.
The hypothesis testing process involves collecting data and using statistical procedures to evaluate which hypothesis is more consistent with the evidence. Crucially, hypothesis testing doesn’t prove hypotheses true or false in an absolute sense. Instead, it provides a systematic method for weighing evidence and making decisions under uncertainty.
The decision-making process follows a specific logic: researchers establish a threshold for “unusual” results (typically 5% probability), then determine whether their observed data would be considered unusual if the null hypothesis were true. If the data would be very unlikely under the null hypothesis, researchers conclude they have sufficient evidence to reject it in favour of the alternative.
This framework has profound implications for interpreting research findings. The statistical significance testing process is designed to control the rate of false positive conclusions – instances where researchers incorrectly conclude an effect exists when it doesn’t. However, this conservative approach means that some genuine effects may fail to reach statistical significance, particularly in small studies or when effect sizes are modest.
Table 1: Hypothesis Testing Decision Matrix
| True State | Your Decision | Result |
|---|---|---|
| No effect exists | Conclude no effect | Correct |
| No effect exists | Conclude effect exists | Type I Error |
| Effect exists | Conclude no effect | Type II Error |
| Effect exists | Conclude effect exists | Correct |
P-values Explained: What They Tell You (And What They Don’t)
How to Interpret P-values Correctly
P-values represent one of the most frequently reported yet widely misunderstood statistics in research. At its most basic level, a p-value indicates the probability of obtaining your observed results (or results more extreme) if the null hypothesis were actually true.
This definition requires careful unpacking. The p-value doesn’t tell you the probability that your hypothesis is correct, nor does it indicate the probability that your results occurred by chance. Instead, it answers a very specific question: “If there really is no effect (i.e., if the null hypothesis is true), how likely would it be to see data at least as extreme as what I observed?”
Consider a practical example from educational research. Suppose you’re comparing reading scores between two groups of children, and you observe a 5-point difference in average scores with a p-value of 0.03. This p-value means that if the two groups actually had identical reading abilities (the null hypothesis), you would expect to see a difference of 5 points or larger in only 3% of similar studies due to random sampling variation.
The conventional threshold of p < 0.05 represents an arbitrary but widely accepted standard. This threshold means researchers are willing to accept a 5% chance of incorrectly concluding an effect exists when it doesn’t. The American Statistical Association’s 2016 statement on p-values emphasised that this threshold should not be treated as a bright line between truth and falsehood, but rather as one piece of evidence to consider alongside other information.
P-values exist on a continuum, and smaller values provide stronger evidence against the null hypothesis. A p-value of 0.001 provides much stronger evidence than p = 0.049, even though both would be considered “statistically significant” under conventional criteria. This is why many researchers now report exact p-values rather than simply stating “p < 0.05.”
Understanding p-values correctly requires recognising what they don’t tell you. P-values provide no information about the size of an effect, its practical importance, or the probability that your research hypothesis is correct. These crucial pieces of information require additional statistical measures, particularly effect sizes and confidence intervals.
Common P-value Misconceptions
Despite their widespread use, p-values are subject to persistent misinterpretations that can lead to serious errors in research conclusions. Addressing these misconceptions is crucial for anyone working with research evidence in educational or developmental contexts.
The most common misconception treats the p-value as the probability that the null hypothesis is true. This interpretation seems logical but is fundamentally incorrect. P-values are calculated under the assumption that the null hypothesis is true – they cannot tell you the probability that this assumption is correct. The distinction is subtle but important: p-values tell you about the compatibility of your data with the null hypothesis, not the likelihood that the null hypothesis is true.
Another frequent error involves interpreting p-values as the probability that results occurred by chance. This misinterpretation conflates the probability of the data with the probability of the hypothesis. P-values indicate how likely your specific data patterns would be under the null hypothesis, but they don’t directly address whether chance produced your results.
The arbitrary nature of the 0.05 threshold creates additional problems. Many researchers treat this boundary as sacred, leading to dramatically different interpretations of results with p-values of 0.049 versus 0.051. This “statistical significance filter” can distort research conclusions and publication patterns, as studies with p-values just below 0.05 are more likely to be published and cited than those just above this threshold.
P-values also cannot indicate the size or importance of an effect. A very large study might detect a statistically significant but practically trivial difference, while a small study might fail to detect a large and important effect. This limitation is particularly relevant in educational research, where interventions might produce statistically significant improvements that are too small to matter in real classroom settings.
The relationship between p-values and replication represents another area of confusion. A statistically significant result doesn’t guarantee that the same finding will emerge in future studies. Replication depends on many factors, including effect size, study design, and sample characteristics, not just the original p-value.
Table 2: P-value Misconceptions vs Reality
| What People Think P-values Mean | What P-values Actually Mean |
|---|---|
| Probability null hypothesis is true | How compatible data is with null hypothesis |
| Probability results occurred by chance | Probability of this data if null is true |
| Larger effects have smaller p-values | Sample size also affects p-values |
| p < 0.05 means important finding | Statistical ≠ practical significance |
P-values in Context: Sample Size and Practical Significance
The relationship between sample size and p-values creates one of the most important yet underappreciated aspects of statistical interpretation. Understanding this relationship is crucial for evaluating research findings appropriately, particularly when comparing studies with different sample sizes.
Large sample sizes make it easier to detect statistically significant effects, even when those effects are small and potentially unimportant. This occurs because p-values depend not only on the size of an observed effect but also on the precision of that estimate, which increases with sample size. In very large studies, even tiny differences can achieve statistical significance simply because they are measured very precisely.
Consider two hypothetical studies of a reading intervention. Study A includes 50 children and finds a 3-point improvement in reading scores with p = 0.15 (not statistically significant). Study B includes 5,000 children and finds the same 3-point improvement with p = 0.001 (highly statistically significant). The practical meaning of the intervention is identical in both cases, but the statistical conclusions differ dramatically due to sample size differences.
This phenomenon has important implications for interpreting research in fields like education and child development, where effect sizes are often modest but sample sizes vary widely. Large-scale studies might detect statistically significant effects that are too small to be educationally meaningful, while smaller studies with adequate effect sizes might fail to reach statistical significance.
The solution involves considering statistical and practical significance together. Statistical significance indicates whether an effect is likely to be real rather than due to chance, while practical significance addresses whether that effect is large enough to matter in real-world contexts. Child development research increasingly emphasises this dual consideration, recognising that both statistical reliability and practical importance are necessary for meaningful research conclusions.
Conversely, small sample sizes can fail to detect even large and important effects due to insufficient precision. This creates the possibility of Type II errors – failing to identify genuine effects that could inform practice or policy. Understanding these sample size relationships helps researchers and practitioners interpret research findings more appropriately and avoid common pitfalls in evidence evaluation.
Type I and Type II Errors: Understanding Statistical Mistakes
Type I Errors: False Positives
Type I errors occur when researchers conclude that an effect exists when, in reality, no effect is present in the population. These “false positive” findings represent one of the most significant concerns in research interpretation, as they can lead to adoption of ineffective interventions or incorrect theoretical conclusions.
The probability of making a Type I error is directly controlled by the alpha level (α), which represents the significance threshold researchers set before conducting their study. The conventional alpha level of 0.05 means that researchers accept a 5% chance of incorrectly concluding an effect exists when it doesn’t. This represents a conscious trade-off: researchers are willing to accept some risk of false positive conclusions in exchange for the ability to detect genuine effects.
Type I errors have serious consequences in educational and developmental contexts. For example, incorrectly concluding that a new teaching method improves student outcomes could lead schools to invest time and resources in an ineffective approach. Similarly, falsely identifying risk factors for developmental delays could cause unnecessary concern for families and practitioners.
Several factors influence Type I error rates beyond the chosen alpha level. Multiple testing situations, where researchers examine many different variables or conduct numerous statistical comparisons, dramatically increase the chances of finding spurious significant results. If a researcher conducts 20 separate statistical tests, each with α = 0.05, the probability of obtaining at least one “significant” result by chance alone approaches 65%.
The “file drawer problem” exacerbates Type I error concerns in published literature. Studies with statistically significant findings are more likely to be published than those with non-significant results, creating a systematic bias toward false positive findings in the research literature. This publication bias means that practitioners reading research journals may encounter a higher rate of Type I errors than the nominal alpha level suggests.
Understanding Type I errors is particularly important when evaluating research on early childhood interventions or educational practices. The enthusiasm for promising new approaches must be balanced against the recognition that some significant findings may represent false positives rather than genuine effects.
Type II Errors: False Negatives
Type II errors represent the flip side of the statistical decision-making process – instances where researchers fail to detect genuine effects that actually exist in the population. These “false negative” conclusions can be equally problematic, potentially leading to abandonment of effective interventions or failure to identify important developmental patterns.
The probability of making a Type II error is denoted by beta (β), and it depends on several factors including effect size, sample size, measurement precision, and the chosen alpha level. Unlike Type I error rates, which are directly controlled by the alpha level, Type II error rates must be managed through careful study design and adequate statistical power.
Statistical power, defined as 1 – β, represents the probability of correctly detecting an effect that truly exists. Conventional standards suggest that studies should achieve power of at least 0.80, meaning an 80% chance of detecting a genuine effect. However, many published studies, particularly in educational and psychological research, fall short of this standard.
Type II errors carry significant opportunity costs in applied research contexts. Failing to identify effective educational interventions means missing opportunities to improve student outcomes. Similarly, overlooking important developmental risk factors could delay necessary support services for children who need them.
Several strategies can reduce Type II error rates. Increasing sample sizes improves statistical power, but this approach may be constrained by practical or financial limitations. Improving measurement precision through better instruments or procedures can also enhance power. Additionally, using more sensitive statistical analyses or reducing measurement error can help detect genuine effects more reliably.
The relationship between Type I and Type II errors creates an inherent tension in research design. More stringent criteria for statistical significance (lower alpha levels) reduce false positive rates but increase false negative rates. Conversely, more lenient significance criteria increase the chance of detecting genuine effects but also raise the risk of false positives.
Table 3: Type I vs Type II Errors
| Error Type | What Happens | Probability | Consequences |
|---|---|---|---|
| Type I (False Positive) | Conclude effect exists when it doesn’t | Alpha (α) = 0.05 | Adopt ineffective practices |
| Type II (False Negative) | Miss effect that actually exists | Beta (β) varies | Miss effective interventions |
Balancing Error Types in Research Design
Effective research design requires thoughtful consideration of both Type I and Type II error risks. Rather than focusing exclusively on controlling one type of error, researchers must consider the relative costs and consequences of false positive versus false negative conclusions in their specific context.
The traditional emphasis on controlling Type I errors through significance testing reflects a conservative research philosophy that prioritises avoiding false claims over detecting true effects. This approach makes sense in contexts where false positive conclusions could cause significant harm, such as medical research where ineffective treatments might replace proven ones.
However, in educational and developmental research contexts, the balance between error types may warrant reconsideration. The cost of missing effective interventions (Type II errors) might outweigh the cost of occasionally pursuing ineffective approaches (Type I errors), particularly when interventions are relatively low-risk or when current practices are inadequate.
Context-specific considerations should guide decisions about error balance. When evaluating assessment approaches for identifying children who need additional support, the consequences of false negatives (missing children who need help) might be considered more serious than false positives (providing support to children who don’t strictly need it).
Power analysis provides a systematic approach to balancing these considerations during research planning. By specifying desired power levels alongside alpha levels, researchers can design studies that achieve acceptable rates of both error types. This approach requires estimating expected effect sizes and determining minimum meaningful effect sizes worth detecting.
The practical implications of error balancing extend beyond individual studies to research synthesis and policy decisions. When multiple studies address the same question with mixed results, understanding the error characteristics of different studies helps weight the evidence appropriately. Studies with adequate power to detect meaningful effects provide stronger evidence than underpowered studies, regardless of their specific statistical conclusions.
Effect Sizes: Measuring What Really Matters
Why Effect Sizes Matter More Than P-values
Effect sizes address one of the most significant limitations of p-value-based inference: they quantify the magnitude and practical importance of research findings. While p-values tell you whether an effect is likely to be genuine rather than due to chance, effect sizes tell you how big that effect is and whether it’s large enough to matter in real-world contexts.
The distinction between statistical and practical significance becomes crucial when interpreting research findings. A statistically significant result simply means that the observed effect is unlikely to have occurred by chance alone. However, this says nothing about whether the effect is large enough to justify changes in practice or policy. Effect sizes bridge this gap by providing standardised measures of how much difference an intervention or variable actually makes.
Consider research on educational interventions, where statistically significant improvements might translate to very small gains in student achievement. An intervention that produces a statistically significant improvement of 2 points on a 100-point reading assessment might not justify the time and resources required for implementation, even though the finding is “significant” in statistical terms.
Effect sizes solve the sample size dependency problem that plagues p-value interpretation. Unlike p-values, which become smaller with larger sample sizes regardless of practical importance, effect sizes remain constant across different sample sizes for the same underlying phenomenon. This makes effect sizes particularly valuable for comparing findings across studies with different designs and participant numbers.
The emphasis on effect sizes reflects a broader shift in research methodology toward estimation rather than simple hypothesis testing. Rather than asking “Is there an effect?” researchers increasingly focus on “How big is the effect and what does it mean?” This approach provides more actionable information for practitioners and policymakers who need to make decisions about resource allocation and intervention implementation.
Educational research has been particularly influenced by this shift, with many journals now requiring effect size reporting alongside significance tests. Research on educational assessment increasingly emphasises the practical significance of findings, recognising that small statistically significant effects may not translate to meaningful improvements in student outcomes.
Common Effect Size Measures
Different types of research questions require different effect size measures. Understanding the most common measures and their appropriate applications helps researchers and practitioners interpret research findings appropriately and compare results across studies.
Cohen’s d represents the most widely used effect size measure for comparing means between two groups. It expresses the difference between group means in terms of pooled standard deviation units, creating a standardised measure that can be compared across different studies and measurement scales. Cohen’s d values of 0.2, 0.5, and 0.8 are conventionally interpreted as small, medium, and large effects, respectively.
For example, if a reading intervention produces a Cohen’s d of 0.5, this means the average child in the intervention group scored half a standard deviation higher than the average child in the control group. This translates to moving from the 50th percentile to approximately the 69th percentile of the control group distribution.
Eta squared (η²) and partial eta squared provide effect size measures for analyses involving multiple groups or variables, such as ANOVA designs. These measures indicate the proportion of variance in the outcome variable that is explained by the predictor variable. Values of 0.01, 0.06, and 0.14 correspond to small, medium, and large effects respectively.
Correlation coefficients (r) serve dual purposes as both statistical tests and effect size measures. When used as effect sizes, correlations indicate the strength of linear relationships between variables. Cohen’s guidelines suggest r = 0.1, 0.3, and 0.5 as small, medium, and large effects, though these benchmarks should be considered in the context of specific research domains.
Odds ratios provide effect size measures for categorical outcomes, particularly in medical and epidemiological research. An odds ratio of 2.0 indicates that the likelihood of an outcome is twice as high in one group compared to another. These measures are particularly useful when studying risk factors or intervention effects on binary outcomes like graduation rates or diagnosis status.
The choice of effect size measure should align with the research design and the nature of the outcome variable. Continuous outcomes typically use standardised mean differences, while categorical outcomes require odds ratios or risk ratios. Within-subjects designs may use different effect size calculations than between-subjects comparisons.
Table 4: Effect Size Guidelines
| Measure | Small | Medium | Large |
|---|---|---|---|
| Cohen’s d | 0.2 | 0.5 | 0.8 |
| Eta squared (η²) | 0.01 | 0.06 | 0.14 |
| Correlation (r) | 0.1 | 0.3 | 0.5 |
| Odds Ratio | 1.5 | 2.5 | 4.0 |
Calculating and Reporting Effect Sizes
Proper calculation and reporting of effect sizes requires attention to both mathematical accuracy and contextual interpretation. While statistical software increasingly provides automatic effect size calculations, understanding the underlying concepts helps ensure appropriate interpretation and communication of findings.
Cohen’s d calculation involves subtracting the control group mean from the treatment group mean and dividing by the pooled standard deviation. The pooled standard deviation provides a weighted average of the variability in both groups, ensuring that the effect size isn’t distorted by differences in group variability. When sample sizes differ substantially between groups, this pooling procedure becomes particularly important.
Confidence intervals around effect sizes provide crucial information about the precision of effect size estimates. Just as p-values indicate the reliability of significance tests, confidence intervals show the range of plausible values for the true effect size. Wide confidence intervals suggest that the effect size estimate is imprecise and should be interpreted cautiously.
Context-specific interpretation of effect sizes often provides more meaningful guidance than generic benchmarks. In educational research, effect sizes of 0.25 might represent meaningful improvement given typical intervention effects, while the same effect size might be considered small in other domains. Understanding the distribution of effect sizes within specific research areas helps calibrate expectations appropriately.
When reporting effect sizes, researchers should provide both the point estimate and its confidence interval, along with sufficient information for readers to verify calculations. This includes group means, standard deviations, and sample sizes for basic comparisons. Clear interpretation of what the effect size means in practical terms helps readers understand the real-world significance of findings.
Research on learning outcomes measurement increasingly emphasises the importance of considering both statistical significance and effect sizes when evaluating intervention effectiveness. This dual focus helps ensure that research conclusions reflect both the reliability and the practical importance of findings, leading to more informed decisions about educational practices and policies.
Statistical Power and Sample Size Considerations
Understanding Statistical Power
Statistical power represents the probability that a study will correctly identify a genuine effect when one actually exists in the population. This concept is fundamental to research design and interpretation, yet it often receives insufficient attention in both research planning and result evaluation.
Power depends on four interconnected factors: effect size, sample size, significance level (alpha), and measurement precision. Understanding these relationships helps researchers design adequately powered studies and helps practitioners interpret research findings appropriately. When any three of these factors are known, the fourth can be calculated, making power analysis a valuable tool for research planning.
The relationship between power and effect size is straightforward: larger effects are easier to detect with the same sample size and study design. This relationship explains why some interventions with meaningful practical effects may fail to reach statistical significance in small studies, while trivial effects might achieve significance in very large samples.
Sample size represents the most commonly manipulated factor for achieving adequate power. Doubling the sample size doesn’t double the power; instead, power increases according to the square root of the sample size ratio. This means that detecting small effects requires substantially larger samples than detecting medium or large effects.
The chosen significance level (alpha) also affects power, though in the opposite direction from intuition might suggest. More stringent significance criteria (lower alpha values) reduce power for detecting genuine effects. This creates the Type I versus Type II error trade-off discussed earlier: efforts to reduce false positive rates increase false negative rates.
Measurement precision, often overlooked in power discussions, can significantly impact study power. More reliable and valid measures reduce error variance, making it easier to detect genuine effects. This highlights the importance of using high-quality assessment instruments in educational and developmental research.
Conventional power standards recommend achieving at least 80% power to detect meaningful effect sizes. However, many published studies fall short of this standard, particularly in educational and psychological research where recruitment challenges and resource constraints limit sample sizes. Understanding power limitations helps interpret non-significant results more appropriately.
Table 5: Sample Sizes for 80% Power
| Effect Size | Small (d=0.2) | Medium (d=0.5) | Large (d=0.8) |
|---|---|---|---|
| Per Group | n = 393 | n = 64 | n = 26 |
| Total | n = 786 | n = 128 | n = 52 |
Sample Size Planning
Effective sample size planning requires balancing statistical requirements with practical constraints. While power analysis provides mathematical guidance for achieving desired detection probabilities, real-world research must consider recruitment feasibility, resource limitations, and ethical considerations.
The first step in sample size planning involves specifying the minimum meaningful effect size worth detecting. This decision should be based on theoretical considerations, practical significance thresholds, and previous research findings. Effect sizes that are too small to matter in practice shouldn’t drive sample size decisions, regardless of statistical detectability.
Researchers must also consider the consequences of different types of errors in their specific context. Studies evaluating potentially harmful interventions might prioritise avoiding false positives (Type I errors), suggesting more stringent significance criteria and larger sample sizes. Conversely, studies exploring promising low-risk interventions might emphasise avoiding false negatives (Type II errors), potentially accepting more liberal significance criteria.
Attrition rates significantly impact effective sample sizes, particularly in longitudinal studies common in educational and developmental research. Initial sample size calculations should account for expected dropout rates, with larger initial samples needed to achieve target completed sample sizes. Differential attrition between groups can also bias results and reduce effective power.
Cluster randomization, where intact groups rather than individuals are assigned to conditions, requires special consideration in sample size planning. The effective sample size is smaller than the total number of participants due to dependencies within clusters. Design effects that account for intra-cluster correlation must be incorporated into power calculations.
Multiple outcome measures and analyses can complicate sample size planning. Studies that examine numerous dependent variables or conduct many statistical tests face increased Type I error rates unless statistical adjustments are made. These adjustments typically require larger sample sizes to maintain adequate power for detecting genuine effects.
Research design in early childhood studies increasingly emphasises careful power analysis during the planning stages, recognising that underpowered studies contribute little to scientific knowledge while potentially wasting resources and participant time. Professional guidelines and funding agencies increasingly require power analyses as part of research proposals.
Putting It All Together: Best Practices for Statistical Reporting
Modern Statistical Reporting Standards
Contemporary statistical reporting has evolved significantly beyond simple significance testing, driven by recognition that p-values alone provide insufficient information for understanding research findings. Modern standards emphasise comprehensive reporting that includes effect sizes, confidence intervals, and clear descriptions of practical significance alongside traditional significance tests.
The American Statistical Association’s 2016 statement on p-values catalysed widespread changes in statistical reporting requirements across journals and disciplines. This influential document highlighted common misinterpretations of p-values and recommended focusing on estimation and effect sizes rather than binary significance decisions.
Many journals now require authors to report exact p-values rather than simply indicating “p < 0.05” or “ns” for non-significant results. This change acknowledges that p-values provide continuous evidence against the null hypothesis rather than binary decisions. A p-value of 0.001 provides much stronger evidence than p = 0.049, even though both would be considered “significant” under traditional criteria.
Effect size reporting has become mandatory in many journals, particularly in educational and psychological research. Authors must provide not only the effect size estimate but also its confidence interval and practical interpretation. This requirement ensures that readers can evaluate both the statistical reliability and practical importance of findings.
Confidence intervals receive increasing emphasis as alternatives or supplements to significance testing. Rather than simply asking whether an effect exists, confidence intervals show the range of plausible values for the true effect size. This approach provides more nuanced information about both the magnitude and precision of estimated effects.
Meta-analysis has become the gold standard for research synthesis, requiring standardised effect size reporting to combine results across studies. This development has increased pressure on individual studies to report effects in formats compatible with systematic review procedures, further driving improvements in statistical reporting practices.
Avoiding Common Pitfalls
Several persistent problems continue to plague statistical reporting and interpretation despite increased awareness and improved guidelines. Understanding these pitfalls helps researchers avoid common mistakes and helps practitioners interpret research more critically.
P-hacking represents one of the most serious threats to research integrity. This practice involves conducting multiple analyses, trying different statistical approaches, or selectively reporting results until achieving desired significance levels. P-hacking inflates false positive rates and undermines the reliability of published research findings.
Multiple comparisons problems arise when researchers conduct numerous statistical tests without appropriate adjustments. Each individual test carries a 5% false positive rate, but conducting many tests dramatically increases the probability of finding spurious significant results. Bonferroni corrections and other adjustment procedures help control family-wise error rates but require larger sample sizes to maintain power.
Cherry-picking significant results while ignoring non-significant findings creates systematic bias in research conclusions. This selective reporting problem is exacerbated when researchers explore numerous variables but only report those that achieve significance. Pre-registration of analysis plans helps address this issue by committing researchers to specific hypotheses and analyses before examining data.
Confusing statistical and practical significance remains a persistent problem despite increased emphasis on effect sizes. Researchers sometimes overinterpret small but statistically significant effects or dismiss large effects that fail to reach significance due to power limitations. Clear guidelines for practical significance thresholds help address this confusion.
Inadequate power analysis during study planning leads to underpowered studies that contribute little to scientific understanding. Studies with insufficient power to detect meaningful effects waste resources and may produce misleading non-significant results that suggest effective interventions are ineffective.
Ethical research practices require transparent reporting of all analyses conducted, including those that didn’t achieve significance. This transparency helps other researchers understand the full evidentiary picture and prevents publication bias from distorting the research literature.
Communicating Results to Different Audiences
Effective communication of statistical results requires adapting explanations to match audience knowledge and needs. Academic audiences, practitioners, policymakers, and the general public all require different approaches to statistical communication while maintaining accuracy and avoiding oversimplification.
Academic communications can assume familiarity with statistical concepts but should still emphasise practical interpretation alongside technical details. Researchers should provide sufficient information for replication and meta-analysis while clearly interpreting the practical significance of their findings. Technical details should be available but not overshadow substantive conclusions.
Practitioners need translation of statistical findings into actionable implications for their work. Rather than focusing on p-values and statistical terminology, communications to educators should emphasise what findings mean for classroom practice, intervention implementation, or assessment procedures. Effect sizes should be interpreted in terms of practical benefits for children and families.
Policymakers require clear bottom-line messages about research implications for policy decisions. Communications should focus on the strength of evidence, practical significance, and cost-effectiveness considerations. Statistical uncertainty should be acknowledged without undermining clear policy recommendations when evidence supports them.
Public communications face the greatest challenge in balancing accuracy with accessibility. Media reports often oversimplify research findings or overstate practical implications of individual studies. Clear communication requires avoiding absolute statements while still conveying meaningful implications of research findings.
Visual representations can enhance understanding across all audiences. Effect size plots, confidence interval displays, and forest plots from meta-analyses help communicate statistical concepts more intuitively than tables of numbers. Interactive visualizations allow audiences to explore different aspects of findings according to their interests and expertise levels.
Common language equivalents for statistical terms improve accessibility without sacrificing accuracy. “Practical importance” may be more meaningful than “effect size” for some audiences, while “reliability of findings” might communicate better than “statistical significance.” The key is maintaining conceptual accuracy while using accessible language.
Stakeholder communication in educational contexts requires particular attention to translating research findings into implications for children’s learning and development. Parents, educators, and administrators need different types of information to make informed decisions based on research evidence.
Contemporary Debates and Future Directions
The Replication Crisis and Statistical Reform
The replication crisis has fundamentally challenged traditional approaches to statistical inference and sparked vigorous debates about research methods, publication practices, and the interpretation of statistical results. This crisis emerged from systematic attempts to replicate published findings, which revealed that many significant results could not be reproduced in independent studies.
Psychology and education research have been particularly affected by replication concerns. High-profile replication projects found success rates well below 50% for reproducing significant findings from prestigious journals. These failures have prompted serious reflection about research practices, statistical methods, and the incentive structures that shape scientific publishing.
Multiple factors contribute to replication failures beyond simple statistical chance. Publication bias favors significant results, creating systematic overrepresentation of false positives in the literature. Questionable research practices, including p-hacking and selective reporting, inflate Type I error rates beyond nominal levels. Small sample sizes and underpowered studies increase the likelihood that significant findings represent chance occurrences rather than genuine effects.
The replication crisis has catalyzed numerous reform efforts across multiple fronts. Pre-registration of study hypotheses and analysis plans helps prevent p-hacking and selective reporting. Open science practices, including data sharing and transparent reporting, facilitate replication attempts and improve research quality. Many journals now encourage or require replication studies, recognizing their value for establishing reliable scientific knowledge.
Statistical reform efforts focus on moving beyond binary significance testing toward estimation-based approaches. Confidence intervals provide more informative summaries of research findings than simple significant/non-significant classifications. Effect sizes with confidence intervals show both the magnitude and precision of estimated effects, providing crucial information for evaluating practical significance.
Bayesian methods offer alternative frameworks for statistical inference that avoid some problems associated with p-values. These approaches incorporate prior knowledge and provide direct probabilities for research hypotheses rather than indirect evidence through p-values. However, Bayesian methods require additional technical expertise and computational resources that may limit their adoption.
Bayesian Alternatives and New Methods
Bayesian statistical methods represent the most prominent alternative to traditional frequentist approaches, offering solutions to many conceptual problems associated with p-values and significance testing. Unlike frequentist methods that assume fixed population parameters, Bayesian approaches treat parameters as random variables with probability distributions.
Bayes factors provide direct comparisons between competing hypotheses, addressing one of the key limitations of p-values. Rather than testing against a null hypothesis of exactly zero effect, Bayes factors can compare theories that predict different effect sizes or patterns of results. This approach aligns better with how researchers actually think about competing explanations for phenomena.
Credible intervals offer intuitive interpretations that confidence intervals cannot provide. A 95% credible interval contains the true parameter value with 95% probability, matching most people’s intuitive understanding of what such intervals should mean. This contrasts with the complex interpretation required for confidence intervals in frequentist statistics.
Bayesian methods naturally incorporate prior knowledge and uncertainty into statistical analyses. This capability is particularly valuable in applied research where previous studies, theoretical predictions, or practical constraints provide relevant information about likely parameter values. Prior distributions can be updated as new evidence accumulates, providing a coherent framework for cumulative knowledge development.
However, Bayesian approaches face practical challenges that limit their widespread adoption. Specifying appropriate prior distributions requires careful thought and can introduce subjectivity into analyses. Computational demands are higher than for traditional methods, requiring specialized software and technical expertise. Interpretation and communication of Bayesian results may be challenging for audiences familiar with frequentist approaches.
Alternative approaches beyond Bayesian methods continue to emerge. Likelihood-based methods focus on the strength of evidence for different parameter values without requiring prior distributions. Information theoretic approaches, including AIC and BIC model selection criteria, evaluate competing models based on their ability to predict new data. Machine learning cross-validation methods assess model performance through prediction accuracy rather than significance testing.
The goal of these diverse approaches is not to eliminate uncertainty but to characterize and communicate it more accurately. Rather than pretending that statistical tests provide definitive answers, modern statistical approaches acknowledge inherent uncertainty while providing frameworks for making decisions under that uncertainty.
Research methodology in educational contexts increasingly incorporates these alternative approaches, recognising that traditional significance testing alone provides insufficient information for understanding complex educational phenomena. The integration of multiple analytical approaches provides more robust foundations for educational practice and policy decisions.
Conclusion
Statistical significance testing represents a powerful but nuanced tool for evaluating research evidence. Understanding p-values, error types, and effect sizes together provides a comprehensive framework for making informed decisions based on research findings. While p-values indicate whether results are likely genuine rather than due to chance, they cannot tell you about practical importance – that’s where effect sizes become crucial.
The key to effective statistical interpretation lies in moving beyond simple “significant” versus “not significant” classifications. Instead, consider the magnitude of effects, the precision of estimates, and the practical implications for real-world contexts. Modern research emphasises transparent reporting of all three components, acknowledging both the strengths and limitations of statistical evidence.
As the field continues to evolve beyond traditional significance testing, the fundamental goal remains unchanged: using systematic approaches to distinguish meaningful patterns from random variation. Whether you’re evaluating educational interventions, interpreting published research, or planning your own studies, these concepts provide essential tools for evidence-based practice and decision-making.
Frequently Asked Questions
What is meant by statistical significance?
Statistical significance means that your research results are unlikely to have occurred by random chance alone. When a finding is statistically significant (typically p < 0.05), it suggests the observed effect is probably genuine rather than a coincidence. However, statistical significance doesn’t tell you if the effect is large enough to be practically important – you need effect sizes for that information.
Is 0.05 statistically significant?
A p-value of exactly 0.05 represents the conventional boundary for statistical significance, but it’s not automatically significant. Most researchers use p < 0.05 as their threshold, meaning 0.05 would be considered “not quite significant.” However, this arbitrary cutoff shouldn’t be treated as sacred – a p-value of 0.051 isn’t fundamentally different from 0.049 in terms of evidence strength.
What is the p-value for statistical significance?
The conventional p-value threshold for statistical significance is 0.05, meaning there’s less than a 5% chance of seeing such extreme results if no real effect exists. Some fields use stricter thresholds like 0.01 (1% chance) for stronger evidence, while others accept 0.10 (10% chance) for exploratory research. The choice depends on the consequences of making errors in your specific context.
How do you know if statistically significant?
Compare your calculated p-value to your predetermined significance threshold (usually 0.05). If p < 0.05, the result is statistically significant. However, don’t stop there – also examine the effect size to determine practical importance, check confidence intervals for precision, and consider whether the study had adequate power to detect meaningful effects. Statistical significance alone doesn’t guarantee importance.
When to use 0.01 and 0.05 level of significance?
Use α = 0.01 (stricter) when false positives are particularly costly, such as medical research or high-stakes policy decisions. Use α = 0.05 (standard) for most educational and social science research where moderate error tolerance is acceptable. Use α = 0.10 (lenient) for exploratory studies where missing true effects is more concerning than occasional false positives. Consider your field’s norms and error consequences.
Which one best explains p-values in a simple way?
Think of p-values as measuring “surprise” – they tell you how surprised you should be by your data if nothing interesting is actually happening. A small p-value (like 0.01) means “very surprised” – your results would be very unusual if there’s no real effect. A large p-value (like 0.80) means “not surprised at all” – such results could easily occur by random chance alone.
What do the P values mean?
P-values indicate the probability of getting your observed results (or more extreme ones) if the null hypothesis were true. For example, p = 0.03 means there’s only a 3% chance of seeing such data if no real effect exists. Smaller p-values provide stronger evidence against “no effect,” but they don’t tell you how big the effect is or whether it matters practically. Always interpret p-values alongside effect sizes.
What’s the difference between statistical and practical significance?
Statistical significance means your results are unlikely due to chance, while practical significance means the effect is large enough to matter in real-world applications. A study with thousands of participants might find a statistically significant improvement of 0.1 points on a 100-point test, but this tiny effect has no practical value despite being “significant.” Always consider both reliability (statistical significance) and importance (effect size).
What are Type I and Type II errors in simple terms?
Type I error (false positive) means concluding there’s an effect when there isn’t one – like thinking a treatment works when it doesn’t. Type II error (false negative) means missing a real effect – like concluding a treatment doesn’t work when it actually does. Both types of mistakes have consequences, so study design should balance these risks based on which error would be more problematic in your specific situation.
References
American Statistical Association. (2016). Statement on statistical significance and P-values. The American Statistician, 70(2), 131-133.
Bowlby, J. (1988). A secure base: Parent-child attachment and healthy human development. Basic Books.
Bretherton, I. (1992). The origins of attachment theory: John Bowlby and Mary Ainsworth. Developmental Psychology, 28(5), 759-775.
Cohen, J. (1988). Statistical power analysis for the behavioral sciences (2nd ed.). Lawrence Erlbaum Associates.
Dewey, J. (1916). Democracy and education. Macmillan.
Donaldson, M. (1978). Children’s minds. Fontana Press.
Dweck, C. S. (2006). Mindset: The new psychology of success. Random House.
Dweck, C. S., & Leggett, E. L. (1988). A social-cognitive approach to motivation and personality. Psychological Review, 95(2), 256-273.
Elkind, D. (1967). Egocentrism in adolescence. Child Development, 38(4), 1025-1034.
Elkind, D. (1981). The hurried child: Growing up too fast too soon. Addison-Wesley.
Erikson, E. H. (1950). Childhood and society. Norton.
Glass, G. V. (1976). Primary, secondary, and meta-analysis of research. Educational Researcher, 5(10), 3-8.
Green, J. A. (1912). The educational ideas of Pestalozzi. University Tutorial Press.
Greenspan, S. I., & Wieder, S. (1998). The child with special needs: Encouraging intellectual and emotional growth. Addison-Wesley.
Greenspan, S. I., & Wieder, S. (2006). Engaging autism: Using the floortime approach to help children relate, communicate, and think. Da Capo Press.
Hedges, L. V. (1981). Distribution theory for Glass’s estimator of effect size and related estimators. Journal of Educational Statistics, 6(2), 107-128.
Kail, R. V., & Cavanaugh, J. C. (2018). Human development: A life-span view (8th ed.). Cengage Learning.
Mueller, C. M., & Dweck, C. S. (1998). Praise for intelligence can undermine children’s motivation and performance. Journal of Personality and Social Psychology, 75(1), 33-52.
Neyman, J., & Pearson, E. S. (1928). On the use and interpretation of certain test criteria for purposes of statistical inference. Biometrika, 20A(1/2), 175-240.
Pavlov, I. P. (1927). Conditioned reflexes: An investigation of the physiological activity of the cerebral cortex. Oxford University Press.
Pestalozzi, J. H. (1801). How Gertrude teaches her children. Swan Sonnenschein.
Piaget, J. (1936). The origins of intelligence in children. International Universities Press.
Piaget, J. (1954). The construction of reality in the child. Basic Books.
Rogoff, B. (2003). The cultural nature of human development. Oxford University Press.
Silber, K. (1960). Pestalozzi: The man and his work. Routledge & Kegan Paul.
Sullivan, G. M., & Feinn, R. (2012). Using effect size—or why the P value is not enough. Journal of Graduate Medical Education, 4(3), 279-282.
Vygotsky, L. S. (1978). Mind in society: The development of higher psychological processes. Harvard University Press.
Wasserstein, R. L., & Lazar, N. A. (2016). The ASA statement on P-values: Context, process, and purpose. The American Statistician, 70(2), 129-133.
Windholz, G. (1997). Ivan P. Pavlov: An overview of his life and psychological work. American Psychologist, 52(9), 941-946.
Further Reading and Research
Recommended Articles
- Cumming, G. (2014). The new statistics: Why and how. Psychological Science, 25(1), 7-29.
- Lakens, D. (2013). Calculating and reporting effect sizes to facilitate cumulative science: A practical primer for t-tests and ANOVAs. Frontiers in Psychology, 4, 863.
- Simmons, J. P., Nelson, L. D., & Simonsohn, U. (2011). False-positive psychology: Undisclosed flexibility in data collection and analysis allows presenting anything as significant. Psychological Science, 22(11), 1359-1366.
Suggested Books
- Cohen, J. (1988). Statistical Power Analysis for the Behavioral Sciences (2nd ed.). Lawrence Erlbaum Associates.
- Comprehensive guide to power analysis and effect sizes with practical examples for educational and psychological research. Essential reference for understanding sample size planning and statistical power concepts.
- Cumming, G. (2012). Understanding the New Statistics: Effect Sizes, Confidence Intervals, and Meta-Analysis. Routledge.
- Modern approach to statistical thinking emphasizing estimation over significance testing. Excellent introduction to confidence intervals and effect size interpretation with educational applications.
- Ziliak, S. T., & McCloskey, D. N. (2008). The Cult of Statistical Significance: How the Standard Error Costs Us Jobs, Justice, and Lives. University of Michigan Press.
- Critique of overreliance on significance testing in social sciences with compelling arguments for considering practical significance. Thought-provoking perspective on statistical reform and evidence-based decision making.
Recommended Websites
- Statistical Thinking for the 21st Century by Russell Poldrack
- Comprehensive online textbook covering modern statistical concepts with interactive examples, R code demonstrations, and emphasis on reproducible research practices for contemporary data analysis.
- American Statistical Association Resources (www.amstat.org)
- Professional guidelines, position statements, and educational materials on proper statistical practice including the influential p-value statement and continuing education resources.
- Effect Size Calculator by David Wilson (www.campbellcollaboration.org)
- Practical tools for calculating various effect size measures with step-by-step guidance for different research designs and statistical analyses commonly used in educational research.
Kathy Brodie
Kathy Brodie is an Early Years Professional, Trainer and Author of multiple books on Early Years Education and Child Development. She is the founder of Early Years TV and the Early Years Summit.

To cite this article please use:
Early Years TV Statistical Significance: P-values, Errors & Effect Sizes Guide. Available at: https://www.earlyyears.tv/statistical-significance-p-values-errors-effect-sizes-guide/ (Accessed: 28 October 2025).