Z-Score: Table, Calculation, Formula, Definition & Interpretation

Introduction
A Z-score, also known as a standard score, is a fundamental statistical measure that plays a crucial role in both statistics and psychology. This powerful tool allows researchers and practitioners to standardise and compare data from different distributions, enabling more meaningful interpretations and analyses.
Definition of Z-score
At its core, a Z-score describes the position of a raw score in relation to the mean of a distribution, expressed in terms of standard deviation units. The formula for calculating a Z-score is:
Z = (X – μ) / σ
Where X is the raw score, μ (mu) is the population mean, and σ (sigma) is the population standard deviation (Coolican, 2019).
In essence, a Z-score tells us how many standard deviations an individual score is away from the mean of its distribution. This simple yet powerful concept allows researchers to transform raw scores from any normal distribution into a standard normal distribution with a mean of 0 and a standard deviation of 1.
Brief overview of Z-Score importance in Statistics and Psychology
The importance of Z-scores in statistics and psychology is multifaceted and far-reaching. Here are some key reasons why Z-scores are invaluable in these fields:
- Standardisation: Z-scores provide a common metric for comparing scores from different distributions. This is particularly useful in psychological research where various scales and measures are often employed.
- Relative position: Z-scores offer immediate insight into where a particular score stands in relation to other scores in the distribution. A positive Z-score indicates that the value is above the mean, while a negative Z-score suggests it is below the mean.
- Probability estimation: Z-scores are intimately linked with probability in a normal distribution. They allow researchers to estimate the likelihood of obtaining a particular score or a more extreme value, which is crucial for hypothesis testing and statistical inference in psychological studies.
- Identifying outliers: In psychological assessments and research, Z-scores help in identifying unusual or extreme scores that may warrant further investigation or consideration.
- Creating composite scores: In psychological testing, Z-scores can be used to combine results from different tests or subscales to create meaningful composite scores.
- Norm-referenced interpretations: Many psychological tests use Z-scores (or transformations of Z-scores) to compare an individual’s performance to that of a normative sample, facilitating meaningful interpretations of test results.
Understanding Z-scores is essential for students, researchers, and practitioners in psychology. They form the foundation for many statistical analyses and are integral to interpreting the results of psychological assessments and research studies. As we delve deeper into the concept, calculation, and application of Z-scores, we will uncover how this seemingly simple measure underpins much of the quantitative work in psychological science.
In the following sections, we will explore the intricacies of Z-scores, including how to calculate them, interpret their values, and apply them in various contexts within psychology and statistics. We will also examine the use of Z-score tables, a valuable tool for quickly determining probabilities associated with specific Z-scores, which is crucial for hypothesis testing and data interpretation.
What is a Z-score?
A Z-score is a fundamental statistical measure that allows us to understand the relative position of a particular value within a dataset. To fully grasp this concept, let’s delve into its definition, components, and visual representation.
Detailed Explanation of the Concept
At its core, a Z-score represents the number of standard deviations a data point is away from the mean of its distribution. This simple yet powerful concept enables us to standardise diverse datasets, making comparisons across different scales and distributions possible.
Imagine you’re a psychology researcher studying reaction times. You have data from two different experiments: one measuring reaction times in milliseconds, and another using seconds. How can you meaningfully compare these results? This is where Z-scores come in handy. By converting raw scores to Z-scores, you create a common metric that allows for direct comparison, regardless of the original units of measurement.
Z-scores have several key properties that make them invaluable in statistical analysis:
- They always have a mean of 0 and a standard deviation of 1.
- Approximately 68% of Z-scores fall between -1 and 1.
- About 95% of Z-scores are between -2 and 2.
- Nearly all (99.7%) Z-scores lie between -3 and 3.
These properties stem from the characteristics of the standard normal distribution, which we’ll explore in more detail shortly.
Formula and Its Components
The formula for calculating a Z-score is:
Z = (X – μ) / σ
Let’s break down each component:
- Z is the Z-score
- X is the raw score (the individual value you’re examining)
- μ (mu) is the population mean
- σ (sigma) is the population standard deviation
To calculate a Z-score, you subtract the population mean from the raw score and then divide by the population standard deviation. This process is called standardisation.
For example, let’s say you’re analysing IQ scores, which have a population mean (μ) of 100 and a standard deviation (σ) of 15. If someone scores 130 on an IQ test, their Z-score would be:
Z = (130 – 100) / 15 = 2
This means their IQ score is 2 standard deviations above the mean.
It’s worth noting that when working with sample data rather than population data, we often use the sample mean (x̄) and sample standard deviation (s) in place of μ and σ (Field, 2017).
Visual Representation: The Standard Normal Distribution Curve
The concept of Z-scores is closely tied to the standard normal distribution, also known as the Z-distribution. This is a special case of the normal distribution where the mean is 0 and the standard deviation is 1 – exactly the properties of Z-scores!
Visualising the standard normal distribution can help us understand Z-scores better:
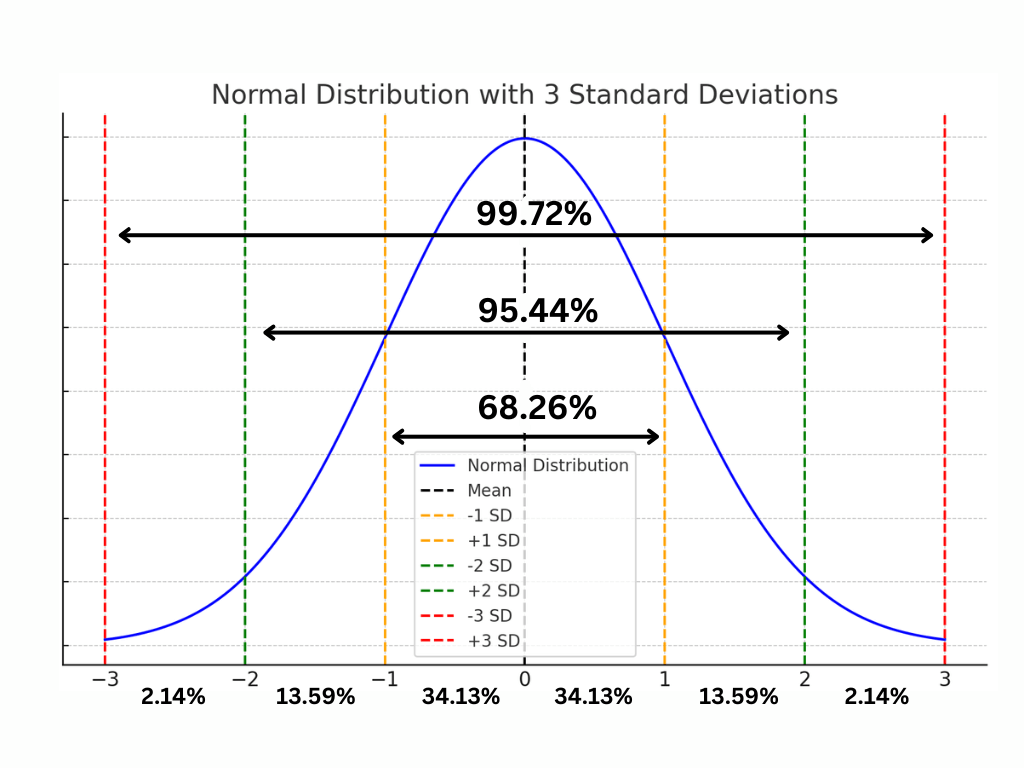
This bell-shaped curve represents the probability distribution of Z-scores. The centre of the curve (at 0) represents the mean, and the spread of the curve shows how data points are distributed around the mean.
The areas under the curve correspond to probabilities. For instance, the area between -1 and 1 (one standard deviation on either side of the mean) covers approximately 68% of the total area under the curve. This aligns with one of the key properties of Z-scores mentioned earlier.
Understanding this visual representation can be incredibly helpful when interpreting Z-scores. For example, a Z-score of 2 not only tells us that a value is two standard deviations above the mean, but also that it’s in the top 2.3% of all values in the distribution (since about 97.7% of values fall below 2 standard deviations from the mean).
By mastering the concept of Z-scores, you gain a powerful tool for standardising, comparing, and interpreting data across various contexts in psychology and statistics. As we progress through this article, we’ll explore how to calculate Z-scores, interpret their values, and apply them in practical scenarios.
Importance of Z-scores
Z-scores are a cornerstone of statistical analysis, playing a crucial role in various fields, including psychology, education, and social sciences. Their importance stems from their versatility and the unique insights they provide. Let’s explore the key areas where Z-scores prove invaluable.
Standardization of Data
One of the primary strengths of Z-scores lies in their ability to standardize data. This process transforms scores from any normal distribution into a standard normal distribution with a mean of 0 and a standard deviation of 1.
Imagine you’re a psychologist comparing the results of two different intelligence tests. The first test has a mean of 100 and a standard deviation of 15, while the second has a mean of 50 and a standard deviation of 10. How can you meaningfully compare scores from these tests? This is where Z-scores come to the rescue.
By converting the raw scores to Z-scores, you create a common scale that allows for direct comparison. For instance, a score of 115 on the first test and 60 on the second test would both translate to a Z-score of 1, indicating that both scores are one standard deviation above their respective means.
This standardization process is particularly useful in psychological research and assessment, where different scales and measures are often employed. It allows researchers to combine or compare results from various instruments, ensuring that apples are compared with apples, so to speak.
Comparison Across Different Datasets
Building on the concept of standardization, Z-scores facilitate comparisons across different datasets, even when the original scales are vastly different. This capability is invaluable in comparative studies and meta-analyses.
For example, consider a study examining academic performance across different countries. Each country might use its own grading system, making direct comparisons challenging. By converting all scores to Z-scores, researchers can create a level playing field, allowing for meaningful cross-country comparisons.
In the realm of psychological assessment, Z-scores enable the creation of composite scores. For instance, a clinician might want to combine scores from tests of verbal ability, numerical reasoning, and spatial awareness to create an overall cognitive ability score. Z-scores make this possible by providing a common metric.
Identifying Outliers
Z-scores serve as an excellent tool for identifying outliers in a dataset. Outliers are extreme values that deviate significantly from other observations and can have a substantial impact on statistical analyses.
In practice, values with Z-scores beyond ±3 are often considered potential outliers, as they fall outside 99.7% of the data in a normal distribution. However, the exact threshold can vary depending on the specific context and requirements of the study.
For instance, in a study of reaction times, a researcher might use Z-scores to identify participants with unusually slow or fast responses. These outliers could represent individuals with exceptional abilities, measurement errors, or other factors worthy of further investigation.
It’s important to note that while Z-scores can help identify potential outliers, the decision to include or exclude these values should be based on careful consideration of the research context and not solely on statistical criteria.
Probability Estimation
Z-scores provide a powerful means of estimating probabilities within a normal distribution. This capability is fundamental to many statistical procedures, including hypothesis testing and confidence interval calculations.
The standard normal distribution associated with Z-scores allows us to determine the probability of obtaining a score at least as extreme as a given value. For example, we know that approximately 68% of Z-scores fall between -1 and 1, 95% between -2 and 2, and 99.7% between -3 and 3.
These probabilities are crucial in psychological research and practice. For instance, a clinician might use Z-scores to determine how unusual a patient’s test result is compared to the general population. A Z-score of 2 on an anxiety measure would indicate that the patient’s anxiety level is higher than about 97.7% of the population, providing valuable context for diagnosis and treatment planning.
In research settings, Z-scores form the basis for many statistical tests. The ability to convert raw scores to Z-scores and then to probabilities underpins techniques such as t-tests, ANOVAs, and regression analyses, which are staples of psychological research methodology.
Moreover, Z-scores play a vital role in the construction of confidence intervals. These intervals, which provide a range of plausible values for a population parameter, are essential for interpreting research findings and making inferences about populations based on sample data.
In conclusion, the importance of Z-scores in statistical analysis cannot be overstated. Their ability to standardize data, facilitate comparisons across datasets, identify outliers, and estimate probabilities makes them an indispensable tool in the researcher’s and practitioner’s toolkit. As we delve deeper into the practical applications of Z-scores in subsequent sections, you’ll gain an even greater appreciation for their versatility and power in psychological research and beyond.
Interpreting Z-scores
Interpreting Z-scores is a crucial skill for anyone working with statistics in psychology or related fields. Let’s explore how to understand these scores and their significance in research contexts.
Understanding Positive and Negative Values
Z-scores can be positive, negative, or zero, and each of these has a specific interpretation:
- A positive Z-score indicates that the raw score is above the mean of the distribution.
- A negative Z-score shows that the raw score is below the mean.
- A Z-score of zero means the raw score is exactly equal to the mean.
For example, imagine we’re looking at scores on a depression inventory. A Z-score of +1.5 would indicate that an individual’s depression score is 1.5 standard deviations above the mean, suggesting higher-than-average levels of depressive symptoms. Conversely, a Z-score of -0.5 would indicate that the score is half a standard deviation below the mean, pointing to lower-than-average depressive symptoms.
It’s important to remember that the interpretation of whether a positive or negative Z-score is “good” or “bad” depends entirely on the context of what’s being measured. In our depression example, a negative Z-score might be seen as positive from a clinical perspective, while in a test of cognitive ability, a positive Z-score might be considered more favourable.
Relationship to Standard Deviations
The beauty of Z-scores lies in their direct relationship to standard deviations. A Z-score tells us precisely how many standard deviations a score is from the mean. This relationship allows us to quickly understand the relative position of a score within its distribution.
Here’s a helpful way to think about common Z-score values:
- A Z-score of ±1 is one standard deviation away from the mean.
- A Z-score of ±2 is two standard deviations from the mean.
- A Z-score of ±3 is three standard deviations from the mean.
This relationship to standard deviations is particularly useful when we consider the properties of the normal distribution. In a normal distribution:
- About 68% of scores fall within one standard deviation of the mean (between Z-scores of -1 and +1).
- Approximately 95% of scores are within two standard deviations (between Z-scores of -2 and +2).
- Nearly all scores (99.7%) fall within three standard deviations (between Z-scores of -3 and +3).
Understanding these properties helps us interpret the rarity or commonness of a particular score. For instance, a Z-score of 2.5 would be considered quite rare, as it falls outside the range where 95% of scores typically lie.
Practical Significance in Psychological Research
In psychological research, Z-scores play a crucial role in various aspects of data analysis and interpretation. Let’s explore some practical applications:
- Norm-Referenced Testing: Many psychological tests use Z-scores (or transformations of Z-scores) to compare an individual’s performance to a normative sample. For example, an IQ test might report scores in terms of standard deviations from the mean, which is essentially a Z-score interpretation.
- Clinical Assessment: Z-scores can help clinicians understand the severity of symptoms or the effectiveness of interventions. A change in Z-score from pre- to post-treatment can provide a standardised measure of improvement.
- Research Comparisons: When comparing results across different studies or measures, Z-scores provide a common language. This is particularly useful in meta-analyses, where researchers need to combine results from multiple studies that might have used different scales or measures.
- Effect Size Calculation: In many cases, Z-scores form the basis for calculating effect sizes, such as Cohen’s d. These effect sizes help researchers understand the magnitude of differences between groups or the strength of relationships between variables.
- Outlier Detection: In data cleaning and preparation, Z-scores can help identify potential outliers. Scores with very high or low Z-scores (typically beyond ±3) might warrant further investigation.
- Probability Estimation: Z-scores are directly linked to probabilities in a normal distribution. This allows researchers to estimate the likelihood of obtaining a score as extreme as or more extreme than a given value, which is fundamental to many statistical tests.
Consider a practical example: A researcher is studying the effects of a new cognitive enhancement technique. They administer a standardised memory test before and after the intervention. By converting the raw scores to Z-scores, they can precisely quantify how much each participant’s performance has changed relative to the standard deviation of the test. A change from a Z-score of 0 to a Z-score of 1 would indicate an improvement of one standard deviation, which could be considered a substantial effect.
It’s worth noting that while Z-scores are incredibly useful, they do have limitations. They assume a normal distribution of the underlying data, which isn’t always the case in psychological variables. Additionally, they don’t provide information about the absolute magnitude of differences when the original scales have different units of measurement.
In conclusion, interpreting Z-scores is about understanding their sign (positive or negative), their magnitude in relation to standard deviations, and their practical implications in research contexts. By mastering these interpretations, researchers and practitioners in psychology can gain deeper insights from their data and communicate their findings more effectively.
Z-scores in Hypothesis Testing
Z-scores play a crucial role in hypothesis testing, which is a fundamental aspect of statistical analysis in psychological research. Let’s explore how Z-scores are used in this context, focusing on their role in statistical analysis, significance levels and critical values, and the difference between one-tailed and two-tailed tests.
Role in Statistical Analysis
In statistical analysis, Z-scores are instrumental in converting raw data into a standardized form that allows us to make probabilistic statements about our observations. This standardization is particularly useful in hypothesis testing, where we’re often trying to determine if an observed result is significantly different from what we would expect by chance.
When we conduct a hypothesis test, we’re essentially asking: “How likely is it that we would observe this result if our null hypothesis were true?” The null hypothesis typically assumes no effect or no difference between groups. Z-scores help us answer this question by telling us how many standard deviations away from the mean our observed result is.
For example, imagine we’re testing a new memory enhancement technique. Our null hypothesis might be that the technique has no effect, and any improvements we see are due to chance. If participants’ memory scores after using the technique have a Z-score of 2.5, we know that this result is 2.5 standard deviations above the mean. But is this enough to reject our null hypothesis?
This is where significance levels and critical values come into play.
Significance Levels and Critical Values
In hypothesis testing, we use significance levels to determine how strong the evidence needs to be before we’re willing to reject the null hypothesis. The most commonly used significance level in psychology is 0.05, which means we’re willing to accept a 5% chance of incorrectly rejecting the null hypothesis (a Type I error).
Critical values are the Z-scores that correspond to our chosen significance level. For a two-tailed test with a significance level of 0.05, the critical values are -1.96 and 1.96. This means that if our calculated Z-score falls below -1.96 or above 1.96, we would reject the null hypothesis.
Here’s how we might think about this process:
- We start with our null hypothesis (e.g., the memory technique has no effect).
- We collect data and calculate a Z-score for our observed result.
- We compare our Z-score to the critical values.
- If our Z-score is more extreme than the critical values, we reject the null hypothesis.
In our memory enhancement example, our Z-score of 2.5 is more extreme than the critical value of 1.96, so we would reject the null hypothesis and conclude that the memory technique likely does have an effect.
One-Tailed vs. Two-Tailed Tests
The choice between one-tailed and two-tailed tests is another important consideration in hypothesis testing, and it affects how we interpret our Z-scores.
A two-tailed test is used when we’re interested in deviations in either direction from the null hypothesis. In our memory enhancement example, a two-tailed test would be appropriate if we wanted to know whether the technique affected memory performance, regardless of whether it improved or impaired it.
In contrast, a one-tailed test is used when we’re only interested in deviations in one specific direction. If we had strong theoretical reasons to believe that our memory technique could only improve memory (and not impair it), we might use a one-tailed test.
The choice between one-tailed and two-tailed tests affects our critical values:
- For a two-tailed test with α = 0.05, the critical values are ±1.96.
- For a one-tailed test with α = 0.05, the critical value is 1.645 (if we’re looking for positive effects) or -1.645 (for negative effects).
It’s important to note that one-tailed tests have more statistical power (they’re more likely to detect an effect if one exists), but they also limit our ability to detect unexpected effects in the opposite direction.
The use of Z-scores in hypothesis testing extends beyond simple comparisons to critical values. They’re also used in calculating p-values, which give us a more precise measure of the evidence against the null hypothesis. A p-value tells us the probability of obtaining a result at least as extreme as the one we observed, assuming the null hypothesis is true.
In conclusion, Z-scores are a powerful tool in hypothesis testing, allowing us to standardize our observations and make probabilistic statements about our results. By understanding how to interpret Z-scores in the context of significance levels, critical values, and one-tailed versus two-tailed tests, researchers can make more informed decisions about their hypotheses and draw more accurate conclusions from their data.
Remember, while Z-scores and hypothesis tests are valuable tools, they should always be used in conjunction with careful experimental design, thoughtful interpretation, and consideration of practical significance. Statistical significance doesn’t always equate to practical or clinical significance, and it’s crucial to consider the broader context of your research when interpreting your results.
Using Z-score Tables
Z-score tables are invaluable tools in statistical analysis, particularly in psychological assessments. They allow us to quickly convert between Z-scores and probabilities or percentiles without having to perform complex calculations. Let’s explore how to use these tables effectively and see some practical applications in psychological contexts.
How to Read and Use Z-score Tables
Z-score tables, also known as standard normal distribution tables, typically present the cumulative probability for Z-scores. This means they show the probability of a Z-score falling at or below a given value.
Here’s a step-by-step guide to reading a Z-score table:
- Locate the row corresponding to the first two digits of your Z-score (including the sign).
- Find the column that matches the third decimal place of your Z-score.
- The value at the intersection of this row and column is the cumulative probability.
For example, if you have a Z-score of 1.23:
- Find the row for 1.2
- Move across to the column for .03
- The value you find is the probability of a Z-score being 1.23 or less
It’s important to note that most Z-score tables only show positive values. For negative Z-scores, you can use the symmetry of the normal distribution: The probability for a negative Z-score is 1 minus the probability for its positive counterpart.
Let’s consider a concrete example. Suppose you’re analysing the results of a standardised anxiety test, and a particular score corresponds to a Z-score of 1.23. Looking this up in a Z-score table, you might find a value of 0.8907. This means that approximately 89.07% of the population would score at or below this level of anxiety.
Converting Z-scores to Percentiles
One of the most useful applications of Z-score tables is converting Z-scores to percentiles. A percentile tells us the percentage of scores that fall at or below a given value.
To convert a Z-score to a percentile:
- Look up the Z-score in the table to find its cumulative probability.
- Multiply this probability by 100 to get the percentile.
Using our previous example, a Z-score of 1.23 corresponds to a cumulative probability of 0.8907. Multiplying by 100, we get 89.07, meaning this score is at the 89th percentile. In other words, this anxiety score is higher than about 89% of the population.
This conversion is particularly useful in psychological assessments, where it’s often more intuitive to discuss results in terms of percentiles rather than standard deviations.
Practical Examples in Psychological Assessments
Let’s explore some practical examples of how Z-score tables are used in psychological assessments:
- IQ Testing: IQ scores are typically standardised with a mean of 100 and a standard deviation of 15. Suppose someone scores 130 on an IQ test. We can calculate the Z-score as (130 – 100) / 15 = 2. Looking this up in a Z-score table, we find a cumulative probability of about 0.9772. This means the score is at the 97.72nd percentile – higher than about 97.72% of the population.
- Depression Screening: Consider a depression inventory where higher scores indicate more severe symptoms. If a patient’s score has a Z-score of -0.5, we can use the Z-score table to find that this corresponds to about the 30th percentile. This suggests that about 30% of people would score at or below this level, indicating relatively low levels of depressive symptoms.
- Academic Performance: In evaluating student performance, Z-scores can help compare results across different subjects or years. If a student’s maths score has a Z-score of 1.5 and their English score has a Z-score of 0.8, we can use the Z-score table to convert these to percentiles. The maths score (93rd percentile) is relatively stronger than the English score (79th percentile), even if the raw scores aren’t directly comparable.
- Neuropsychological Assessment: In assessing cognitive functions like memory or attention, neuropsychologists often use Z-scores to compare a patient’s performance to normative data. A Z-score of -2 on a memory test would correspond to the 2.28th percentile, indicating significant impairment and potentially warranting further investigation.
- Personnel Selection: In organisational psychology, Z-scores might be used to compare job candidates across different assessment measures. If a candidate’s problem-solving score has a Z-score of 1.2 (88th percentile) and their teamwork score has a Z-score of 0.5 (69th percentile), this gives a clear picture of their relative strengths.
Understanding how to use Z-score tables allows psychologists and researchers to quickly interpret standardised scores in a meaningful way. It provides a common language for discussing test results and comparing performance across different measures or populations.
However, it’s crucial to remember that while Z-scores and percentiles provide valuable information, they should always be interpreted in the context of the specific assessment and the individual being evaluated. Factors such as measurement error, test reliability, and the nature of the trait being measured should all be considered when making interpretations based on Z-scores.
Z-scores in Different Distributions
When we discuss Z-scores, we often assume we’re working with a normal distribution. However, it’s crucial to understand how Z-scores behave in different types of distributions and what limitations we might encounter when applying them to non-normal data. Let’s explore this topic in depth.
Normal Distribution vs. Other Distributions
The normal distribution, also known as the Gaussian distribution or the “bell curve,” is a symmetrical, unimodal distribution where the mean, median, and mode are all equal. In a normal distribution, Z-scores have a straightforward interpretation: they directly correspond to percentiles and probabilities in a consistent way.
For example, in a normal distribution:
- A Z-score of 0 always represents the 50th percentile
- A Z-score of 1 always represents approximately the 84th percentile
- A Z-score of -1 always represents approximately the 16th percentile
This consistency makes Z-scores particularly useful for normal distributions. However, many real-world phenomena in psychology and other fields don’t follow a perfect normal distribution. Let’s consider some other common distributions:
- Skewed Distributions: These are asymmetrical, with the tail on one side longer than the other. For instance, reaction time data often shows a positive skew, with most responses clustered at lower values but a long tail of slower responses.
- Bimodal Distributions: These have two peaks, which might occur when a population consists of two distinct subgroups. For example, scores on a test might be bimodal if some students received special preparation and others didn’t.
- Uniform Distributions: These have equal probability across all values within a range. While rare in psychology, they might occur in certain experimental designs.
- Leptokurtic Distributions: These have heavier tails and a higher, sharper peak than a normal distribution. They’re sometimes seen in financial data.
- Platykurtic Distributions: These have lighter tails and a lower, flatter peak than a normal distribution. They might occur in some personality trait measures.
In these non-normal distributions, Z-scores can still be calculated using the same formula: Z = (X – μ) / σ. However, their interpretation becomes more complex and potentially misleading.
Limitations and Considerations
When working with Z-scores in non-normal distributions, several important limitations and considerations come into play:
- Percentile Interpretation: In non-normal distributions, the relationship between Z-scores and percentiles isn’t as straightforward as in the normal distribution. For instance, in a heavily skewed distribution, a Z-score of 1 might not correspond to the 84th percentile.
- Outlier Sensitivity: Z-scores are based on the mean and standard deviation, which can be heavily influenced by outliers. In skewed distributions with extreme values, this can lead to misleading Z-scores.
- Probability Calculations: The standard normal distribution table, which we use to convert Z-scores to probabilities, assumes normality. Using it for non-normal distributions can lead to incorrect probability estimates.
- Comparison Across Distributions: While Z-scores can standardize scores within a distribution, comparing Z-scores across different types of distributions can be problematic. A Z-score of 2 might represent a more extreme value in a leptokurtic distribution than in a normal distribution.
- Central Limit Theorem: It’s worth noting that as sample sizes increase, the distribution of sample means tends to approach normality, even if the underlying population distribution is non-normal. This is why some statistical tests that assume normality can still be robust with large sample sizes.
- Transformation Options: In some cases, data can be transformed to more closely approximate a normal distribution. Common transformations include log transformations for positively skewed data or square root transformations for count data. However, these transformations can make interpretation more challenging.
Given these limitations, what should researchers and practitioners do when working with non-normal data? Here are some suggestions:
- Always visualize your data: Histograms, Q-Q plots, and box plots can give you a sense of your data’s distribution.
- Consider alternative measures of central tendency and spread: For skewed distributions, the median and interquartile range might be more appropriate than the mean and standard deviation.
- Use non-parametric tests: These don’t assume a specific distribution and can be more appropriate for non-normal data.
- Be cautious with interpretations: If you do use Z-scores with non-normal data, be very careful about how you interpret them, especially when it comes to probabilities and percentiles.
- Consider robust statistics: Some methods are designed to be less sensitive to departures from normality and the presence of outliers.
- Consult with statisticians: When dealing with complex distributions, it may be helpful to consult with experts who can guide you on the most appropriate analyses.
In conclusion, while Z-scores are a powerful tool in statistical analysis, their application and interpretation become more nuanced when we move beyond the normal distribution. As with all statistical methods, it’s crucial to understand the assumptions underlying Z-scores and to use them thoughtfully and appropriately given the nature of your data. By being aware of these limitations and considerations, researchers can make more informed decisions about when and how to use Z-scores in their analyses.
Calculating Z-scores with Software
In today’s digital age, calculating Z-scores has become much more accessible and efficient thanks to various software options. While it’s crucial to understand the underlying concepts and formulas, using software can significantly speed up the process and reduce the risk of calculation errors. Let’s explore how to calculate Z-scores using Excel, one of the most widely available tools, and then touch on some other statistical software options.
Using Excel for Z-score Calculations
Microsoft Excel is a versatile spreadsheet program that offers several ways to calculate Z-scores. Let’s walk through the process step-by-step:
- Data Entry: First, enter your raw data into a column in Excel. Let’s say you’ve entered your data in column A, starting from cell A1.
- Calculate the Mean: To find the mean of your data set, you can use the AVERAGE function. In a new cell, type:
=AVERAGE(A1:A100)
(Adjust the range A1:A100 to match your actual data range) - Calculate the Standard Deviation: For the standard deviation, use the STDEV.S function for sample data or STDEV.P for population data. In another cell, type:
=STDEV.S(A1:A100) - Calculate Z-scores: Now, to calculate the Z-score for each data point, you’ll use the formula (X – μ) / σ. In Excel, this translates to:
=(A1 – $B$1) / $B$2
(Assuming your mean is in B1 and standard deviation in B2) - Copy the Formula: Copy this formula down the column to calculate Z-scores for all your data points.
Excel also offers a built-in function for Z-scores called STANDARDIZE. You can use it like this:
=STANDARDIZE(A1, $B$1, $B$2)
This function automatically calculates the Z-score using the value in A1, the mean in B1, and the standard deviation in B2.
One of the advantages of using Excel is that you can easily create charts and graphs to visualize your data and Z-scores. For instance, you could create a scatter plot comparing raw scores to Z-scores, or a histogram of Z-scores to visualize their distribution.
It’s important to note that while Excel is user-friendly and widely available, it does have limitations. For very large datasets or more complex statistical analyses, you might need to consider more specialized software.
Other Statistical Software Options
While Excel is excellent for basic Z-score calculations, many researchers and professionals in psychology and related fields use more specialized statistical software. Here are some popular options:
- SPSS (Statistical Package for the Social Sciences): SPSS is widely used in psychology and other social sciences. It offers a user-friendly interface and can handle complex statistical analyses, including Z-score calculations. In SPSS, you can calculate Z-scores using the ‘Descriptives’ procedure or through syntax commands.
- R: R is a powerful, open-source statistical programming language. While it has a steeper learning curve than Excel or SPSS, it offers unparalleled flexibility and is free to use. In R, you can calculate Z-scores using the scale() function or by writing your own function.
- SAS (Statistical Analysis System): SAS is another comprehensive statistical software package often used in research and business settings. It can handle large datasets and complex analyses, including Z-score calculations.
- Python with NumPy and SciPy: For those comfortable with programming, Python, along with its scientific computing libraries NumPy and SciPy, offers powerful tools for statistical analysis. You can easily calculate Z-scores using these libraries.
- Stata: Popular in social sciences and epidemiology, Stata offers a wide range of statistical functions, including Z-score calculations.
- Minitab: Often used in quality improvement contexts, Minitab provides a user-friendly interface for statistical analysis, including Z-score calculations.
Each of these software options has its strengths and is suited to different needs. For instance, R and Python are excellent for reproducible research and handling very large datasets, while SPSS might be more intuitive for those less comfortable with programming.
When choosing software for Z-score calculations and other statistical analyses, consider factors such as:
- The size and complexity of your datasets
- The specific analyses you need to perform
- Your comfort level with programming
- The software commonly used in your field
- Cost and accessibility
Remember, regardless of the software you use, it’s crucial to understand the underlying concepts of Z-scores and to interpret your results correctly. Software can speed up calculations, but it can’t replace critical thinking and careful interpretation of statistical results.
In conclusion, while manual calculations of Z-scores can be instructive for understanding the concept, software tools make the process much more efficient and less error-prone, especially when dealing with large datasets. Whether you’re using Excel for quick calculations or specialized statistical software for more complex analyses, these tools can greatly enhance your ability to work with Z-scores and other statistical measures in your psychological research or practice.
I understand you’d like me to continue with the section on common applications of Z-scores in psychology, covering standardized testing, clinical assessments, and research and data analysis. I’ll provide a thorough explanation of each area, using clear language and examples to illustrate key concepts. I’ll write in continuous prose using British English spelling, and format the headings using Markdown syntax as requested. Let me know if you need any clarification or have additional questions as we go through this material.
Common Applications of Z Score in Psychology
Z-scores find widespread use in various areas of psychology, from educational and clinical settings to research laboratories. Their ability to standardize diverse measurements and provide a common language for comparing different scales makes them invaluable tools for psychologists. Let’s explore three key areas where Z-scores play a crucial role: standardized testing, clinical assessments, and research and data analysis.
Standardized Testing
In educational and psychological testing, Z-scores are fundamental to the process of standardization. Standardized tests are designed to compare an individual’s performance to that of a normative sample, often representing a broader population. This comparison is made possible through the use of Z-scores.
Consider, for example, the Wechsler Intelligence Scale for Children (WISC), a widely used intelligence test for children aged 6 to 16. The raw scores obtained on various subtests (such as vocabulary, block design, or digit span) are converted to scaled scores, which are essentially Z-scores transformed to have a mean of 10 and a standard deviation of 3. This transformation allows psychologists to compare a child’s performance across different subtests and to the performance of other children of the same age.
The use of Z-scores in standardized testing extends beyond intelligence tests. In academic settings, many achievement tests use Z-scores (or transformations of Z-scores) to report results. For instance, the Scholastic Aptitude Test (SAT) in the United States uses a scale that is derived from Z-scores. This allows for year-to-year comparisons of student performance, even if the difficulty of the test varies slightly from one administration to another.
Z-scores in standardized testing offer several advantages:
- They provide a clear indication of how far above or below average a score is.
- They allow for easy comparison across different tests or subtests.
- They can be converted to percentile ranks, which are often more intuitive for test-takers and parents to understand.
However, it’s crucial to remember that while Z-scores provide valuable information, they should not be the sole basis for important educational decisions. Factors such as test reliability, measurement error, and the specific context of the test administration should always be considered.
Clinical Assessments
In clinical psychology, Z-scores play a vital role in assessing and diagnosing various psychological conditions. They help clinicians determine whether an individual’s symptoms or behaviours deviate significantly from the norm, which can be crucial in identifying potential disorders.
For example, in assessing attention-deficit/hyperactivity disorder (ADHD), clinicians often use rating scales that measure various symptoms. The raw scores on these scales can be converted to Z-scores, allowing the clinician to see how the individual’s symptoms compare to those of a normative sample. A Z-score of 2 or higher on a hyperactivity scale, for instance, might indicate that the individual’s level of hyperactivity is significantly higher than average, potentially supporting an ADHD diagnosis.
Z-scores are also valuable in tracking treatment progress. By calculating Z-scores for symptom measures before and after treatment, clinicians can quantify the degree of improvement. For instance, if a patient’s depression score moves from a Z-score of 2 (significantly above average) to a Z-score of 0.5 after treatment, this provides clear evidence of symptom reduction.
In neuropsychological assessments, Z-scores are used to compare an individual’s cognitive functioning to normative data. This is particularly useful in assessing conditions like dementia or traumatic brain injury. For example, if a patient’s memory test score has a Z-score of -2.5, this suggests that their memory performance is significantly below average, potentially indicating cognitive impairment.
It’s important to note that while Z-scores provide valuable information in clinical assessments, they should always be interpreted in the context of the individual’s overall clinical picture. A high Z-score on a single measure is rarely sufficient for a diagnosis; rather, it’s one piece of evidence that contributes to a comprehensive clinical assessment.
Research and Data Analysis
In psychological research, Z-scores are a fundamental tool for data analysis and interpretation. They serve several crucial functions:
- Data Standardization: When comparing or combining data from different measures or scales, Z-scores allow researchers to put everything on a common scale. This is particularly useful in meta-analyses, where researchers aim to synthesize results from multiple studies that may have used different measurement tools.
- Outlier Detection: Z-scores can help identify outliers in a dataset. Data points with Z-scores beyond ±3 are often considered potential outliers, warranting further investigation.
- Effect Size Calculation: In experimental research, Z-scores form the basis for calculating certain effect sizes, such as Cohen’s d. These effect sizes help researchers quantify the magnitude of differences between groups or the strength of relationships between variables.
- Probability Estimation: Z-scores are directly linked to probabilities in a normal distribution. This property is fundamental to many statistical tests used in psychological research, including t-tests, ANOVAs, and regression analyses.
- Creating Composite Scores: In studies that measure multiple related constructs, researchers might use Z-scores to create composite variables. By standardizing each measure and then averaging the Z-scores, researchers can create a single score that represents the broader construct.
For example, imagine a study examining the relationship between stress and academic performance. The researchers might measure stress using several different scales (e.g., perceived stress, cortisol levels, life events inventory). By converting each of these measures to Z-scores and then averaging them, they could create a composite ‘stress’ variable that incorporates all these different aspects of stress.
In data analysis, Z-scores also play a crucial role in many advanced statistical techniques. For instance, in structural equation modeling, a popular technique for testing complex theoretical models in psychology, variables are often standardized (converted to Z-scores) before analysis. This standardization can help with model convergence and make the resulting coefficients easier to interpret.
It’s worth noting that while Z-scores are incredibly useful in research, they do have limitations. They assume a normal distribution of the underlying data, which isn’t always the case in psychological variables. Therefore, researchers should always consider the distribution of their data and use appropriate statistical techniques accordingly.
In conclusion, Z-scores are a versatile and powerful tool in psychology, finding applications in standardized testing, clinical assessments, and research contexts. Their ability to standardize diverse measurements, provide a common language for comparisons, and link directly to probabilities makes them indispensable in many areas of psychological practice and research. However, like all statistical tools, they should be used thoughtfully and in conjunction with other relevant information to ensure accurate and meaningful interpretations.
Conclusion
As we conclude our exploration of Z-scores and their applications in psychology, it’s worthwhile to reflect on the key concepts we’ve covered and to underscore the significance of this statistical tool in both research and practical settings.
Recap of Key Points
Throughout this discussion, we’ve delved into various aspects of Z-scores:
We began by defining Z-scores as a measure that expresses how many standard deviations a data point is from the mean of its distribution. This simple yet powerful concept forms the foundation for numerous statistical analyses in psychology.
We explored the formula for calculating Z-scores: Z = (X – μ) / σ, where X is the raw score, μ is the population mean, and σ is the population standard deviation. This formula allows us to standardise scores from any normal distribution, creating a common metric for comparison.
We discussed the interpretation of Z-scores, noting that positive Z-scores indicate values above the mean, negative Z-scores represent values below the mean, and a Z-score of zero corresponds to the mean itself. We also examined how Z-scores relate to percentiles and probabilities in a normal distribution.
Our journey took us through the practical applications of Z-scores in various psychological contexts. We explored their use in standardised testing, where they help compare individual performance to normative samples. In clinical assessments, we saw how Z-scores aid in diagnosing conditions and tracking treatment progress. In research settings, we discovered their utility in data standardisation, outlier detection, and effect size calculation.
We also delved into the use of Z-score tables and software tools for calculating and interpreting Z-scores. These resources make working with Z-scores more accessible and efficient, though we emphasized the importance of understanding the underlying concepts to ensure appropriate use and interpretation.
Finally, we considered the limitations of Z-scores, particularly when dealing with non-normal distributions. This discussion highlighted the need for careful consideration of data characteristics and appropriate statistical techniques in psychological research.
Importance of Z-scores in Psychological Research and Practice
The ubiquity of Z-scores in psychological research and practice is a testament to their importance and versatility. They serve as a common language that allows psychologists to communicate complex statistical information in a standardised and easily interpretable format.
In research, Z-scores provide a foundation for many statistical analyses. They allow researchers to compare results across different studies, even when the original measurements were made on different scales. This property is particularly valuable in meta-analyses, where researchers aim to synthesize findings from multiple studies to draw broader conclusions about psychological phenomena.
Z-scores also play a crucial role in hypothesis testing, forming the basis for calculating p-values and determining statistical significance. This application is fundamental to the scientific process in psychology, helping researchers distinguish between meaningful effects and random variation.
In clinical practice, Z-scores offer a standardised way to assess individual performance or symptoms relative to a normative population. This standardisation is invaluable in diagnostic processes, helping clinicians identify when an individual’s behaviour or performance deviates significantly from the norm. Moreover, by tracking changes in Z-scores over time, clinicians can quantify treatment progress in a meaningful and statistically sound manner.
In educational psychology, Z-scores underpin many standardised tests, allowing for fair comparisons of student performance across different tests or different administrations of the same test. This application has far-reaching implications for educational policy and individual student support.
However, it’s crucial to remember that while Z-scores are a powerful tool, they are not infallible. They come with assumptions and limitations that must be understood and respected. For instance, the assumption of normality underlying Z-scores doesn’t always hold in psychological data. Therefore, psychologists must be prepared to use alternative methods when dealing with non-normal distributions.
Moreover, while Z-scores provide valuable statistical information, they should never be used in isolation. In both research and practice, Z-scores should be interpreted in conjunction with other relevant information, including qualitative data, contextual factors, and clinical judgment.
In conclusion, Z-scores represent a fundamental concept in psychological statistics, bridging the gap between raw data and meaningful interpretation. Their ability to standardise diverse measurements, facilitate comparisons, and link directly to probabilities makes them an indispensable tool in the psychologist’s arsenal. As we continue to advance our understanding of human behaviour and mental processes, Z-scores will undoubtedly remain a crucial element in our quest for psychological knowledge and effective interventions.
By mastering the concept and application of Z-scores, psychologists equip themselves with a powerful tool for data analysis, interpretation, and communication. Whether in research laboratories, clinical settings, or educational institutions, the ability to work effectively with Z-scores enhances our capacity to generate insights, make informed decisions, and ultimately, to better understand and support human psychological functioning.
Frequently Asked Questions
What Is a Z-score?
A Z-score is a statistical measure that tells us how many standard deviations away from the mean a data point is. It’s calculated by subtracting the population mean from an individual raw score and then dividing the difference by the population standard deviation.
Z-scores allow us to compare data from different distributions by standardizing them to a common scale. This makes it easier to understand the relative position of a score within its distribution and to compare scores across different datasets or tests.
How Do You Calculate a Z-score?
To calculate a Z-score, you use the formula: Z = (X – μ) / σ
Where:
X is the raw score
μ (mu) is the population mean
σ (sigma) is the population standard deviation
For example, if a student scores 75 on a test where the mean is 70 and the standard deviation is 5, their Z-score would be:
Z = (75 – 70) / 5 = 1
This means the student’s score is one standard deviation above the mean.
What Does a Negative Z-score Mean?
A negative Z-score indicates that the raw score is below the mean of the distribution. Specifically, it tells us how many standard deviations below the mean the score is.
For instance, a Z-score of -1.5 means the raw score is 1.5 standard deviations below the mean. This could indicate lower-than-average performance on a test or lower levels of a measured trait compared to the population average.
However, whether a negative Z-score is “good” or “bad” depends entirely on what’s being measured. For some variables, like depression scores, a negative Z-score might actually be desirable.
When Can I Use Z-scores?
Z-scores can be used in various situations where you need to standardize data or compare scores from different distributions. Some common applications include:
- Standardized testing: Comparing scores across different tests or versions of a test.
- Clinical assessments: Evaluating how an individual’s symptoms compare to a normative sample.
- Research: Standardizing data from different measures for analysis, identifying outliers, or calculating effect sizes.
- Performance evaluation: Comparing an individual’s performance to a group average.
Z-scores are most appropriate when working with normally distributed data. For non-normal distributions, other methods of standardization might be more suitable.
What’s the Difference Between a Z-score and a T-score?
Z-scores and T-scores are both standardized scores, but they use different scales:
Z-scores have a mean of 0 and a standard deviation of 1. They can be positive or negative and typically range from about -3 to +3.
T-scores have a mean of 50 and a standard deviation of 10. They’re always positive and typically range from about 20 to 80.
T-scores are actually a linear transformation of Z-scores. To convert a Z-score to a T-score, you multiply the Z-score by 10 and add 50:
T = (Z * 10) + 50
T-scores are often used in psychological assessments because they avoid negative numbers, which can be confusing for some test-takers or clients.
How Do I Interpret Z-scores?
Interpreting Z-scores involves understanding their relationship to the standard normal distribution:
- A Z-score of 0 means the raw score is exactly average.
- Positive Z-scores indicate above-average values, while negative Z-scores indicate below-average values.
- About 68% of scores in a normal distribution fall between -1 and +1.
- About 95% of scores fall between -2 and +2.
- About 99.7% of scores fall between -3 and +3.
For example, a Z-score of 1.5 means the raw score is 1.5 standard deviations above the mean, which is higher than about 93% of scores in the distribution.
Remember, the interpretation of whether a particular Z-score is “good” or “bad” depends on the context of what’s being measured.
Can Z-scores Be Used with Any Type of Data?
While Z-scores can be calculated for any dataset, they are most meaningful and reliable when used with normally distributed data. The standard interpretations of Z-scores (like the 68-95-99.7 rule) only apply to normal distributions.
For non-normal distributions, Z-scores can still be calculated, but their interpretation becomes more complex. In these cases, other methods of standardization or non-parametric techniques might be more appropriate.
It’s always important to examine the distribution of your data before applying Z-scores or any other statistical technique. Visualizing your data through histograms or Q-Q plots can help you determine if Z-scores are appropriate for your analysis.
How Are Z-scores Used in Hypothesis Testing?
Z-scores play a crucial role in hypothesis testing, particularly for large sample sizes. They help us determine whether an observed result is statistically significant or likely due to chance.
In hypothesis testing:
- We calculate a Z-score for our observed result.
- We compare this Z-score to critical values that correspond to our chosen significance level (often 0.05 or 0.01).
- If our Z-score exceeds the critical value, we reject the null hypothesis.
For example, if we’re using a significance level of 0.05 for a two-tailed test, our critical Z-scores would be ±1.96. An observed Z-score outside this range would be considered statistically significant.
Z-scores also form the basis for calculating p-values, which give us a more precise measure of the evidence against the null hypothesis.
What’s the Relationship Between Z-scores and Percentiles?
Z-scores have a direct relationship with percentiles in a normal distribution. This relationship allows us to easily convert between Z-scores and percentiles:
- A Z-score of 0 corresponds to the 50th percentile.
- A Z-score of 1 corresponds to approximately the 84th percentile.
- A Z-score of -1 corresponds to approximately the 16th percentile.
To find the exact percentile for a Z-score, you can use a Z-score table or statistical software. This relationship is particularly useful in interpreting test scores or other measurements where it’s helpful to know what percentage of the population an individual’s score exceeds.
Remember, this relationship is most accurate for normally distributed data. For non-normal distributions, the relationship between Z-scores and percentiles may be different.
References
- Coolican, H. (2019). Research methods and statistics in psychology (7th ed.). Routledge.
- Field, A. (2017). Discovering statistics using IBM SPSS statistics (5th ed.). SAGE Publications.
Further Reading and Research
Recommended Articles
- Field, A., & Wilcox, R. R. (2017). Robust statistical methods: A primer for clinical psychology and experimental psychopathology researchers. Behaviour Research and Therapy, 98, 19-38.
- Coe, R. (2002). It’s the effect size, stupid: What effect size is and why it is important. Paper presented at the Annual Conference of the British Educational Research Association, University of Exeter, England.
- Sullivan, G. M., & Feinn, R. (2012). Using effect size—or why the p value is not enough. Journal of Graduate Medical Education, 4(3), 279-282.
- Dunlap, W. P. (1999). A program to compute McGraw and Wong’s common language effect size indicator. Behavior Research Methods, Instruments, & Computers, 31(4), 706-709.
- Lakens, D. (2013). Calculating and reporting effect sizes to facilitate cumulative science: A practical primer for t-tests and ANOVAs. Frontiers in Psychology, 4, 863.
Suggested Books
- Field, A. (2017). Discovering statistics using IBM SPSS statistics (5th ed.). SAGE Publications. • This comprehensive textbook covers a wide range of statistical concepts, including Z-scores, with practical examples using SPSS software.
- Howell, D. C. (2012). Statistical methods for psychology (8th ed.). Cengage Learning. • An in-depth exploration of statistical methods used in psychological research, including standardised scores and their applications.
- Cohen, J., Cohen, P., West, S. G., & Aiken, L. S. (2003). Applied multiple regression/correlation analysis for the behavioral sciences (3rd ed.). Lawrence Erlbaum Associates. • This book provides a thorough treatment of regression analysis, including the use of standardised variables in complex analyses.
- Coolican, H. (2019). Research methods and statistics in psychology (7th ed.). Routledge. • A comprehensive guide to research methods and statistical analysis in psychology, including detailed explanations of Z-scores and their uses.
- Cumming, G. (2012). Understanding the new statistics: Effect sizes, confidence intervals, and meta-analysis. Routledge. • This book offers a modern perspective on statistics in psychology, emphasising effect sizes and their interpretation.
Recommended Websites
- Statistics How To • This website offers clear, concise explanations of various statistical concepts, including Z-scores, with practical examples and calculators.
- UCLA Institute for Digital Research and Education • Provides comprehensive resources on statistical analysis, including detailed guides on using Z-scores in various statistical software packages.
- StatTrek • Offers free online textbooks, step-by-step solutions to statistics problems, and interactive tools for learning about Z-scores and other statistical concepts.
- OpenIntro Statistics • Provides free, high-quality textbooks and resources for learning statistics, including sections on standardised scores and their applications.
- American Psychological Association (APA) – Statistics & Research Methodology • Offers guidelines, tutorials, and resources for statistical analysis in psychological research, including the use of standardised scores.
To cite this article use:
Early Years TV Z-Score: Calculation, Table, Formula, Definition & Interpretation. Available at: https://www.earlyyears.tv/z-score/ (Accessed: 26 May 2026).
Kathy Brodie
Kathy Brodie is an Early Years Professional, Trainer and Author of multiple books on Early Years Education and Child Development. She is the founder of Early Years TV and the Early Years Summit.
